On April 29, 2026, the United Arab Emirates formally terminated its 59-year membership in the Organization of the Petroleum Exporting Countries (OPEC). The announcement, made in Abu Dhabi, was measured in tone but seismic in implication. Global energy markets registered an initial 4% intraday decline in Brent crude—before the omnipresent geopolitical risk premium, rooted in the ongoing US-Iran maritime conflict in the Persian Gulf, reasserted itself, pushing prices back toward the $88 per barrel range. The relative composure of oil markets in the immediate aftermath should not be mistaken for insignificance. Beneath the surface calm lies a structural inflection point that is reshaping the architecture of global energy governance.
For India—the world’s third-largest oil consumer, importing over 85% of its crude requirements—this development is not a distant geopolitical abstraction. It is a macroeconomic event of the first order, one that will shape the trajectory of the nation’s inflation, fiscal deficit, current account balance, and long-term energy security.
I. A Cartel Under Strain: The Long Decline of OPEC
To understand why the UAE’s exit is consequential, one must first situate it within the broader context of OPEC’s institutional erosion. Founded in September 1960 in Baghdad by five nations—Iran, Iraq, Kuwait, Saudi Arabia, and Venezuela—OPEC was conceived as a counterweight to the “Seven Sisters,” the consortium of Western oil majors that had historically dictated crude prices to producer states. The organisation’s foundational logic was one of collective bargaining: by coordinating production levels, member states could exercise the market power that individual nations lacked.
The 1973 oil embargo represented the zenith of that power. By restricting supplies to Western nations supporting Israel in the Yom Kippur War, OPEC demonstrated that energy could be weaponised as geopolitical leverage. Global oil prices tripled within months, reshaping the international economic order and cementing OPEC’s status as arguably the most powerful inter-governmental economic institution of the twentieth century. At its peak, the cartel commanded over 50% of global oil supply.
That dominance has been progressively undermined by two structural forces. The first is the US shale revolution. Technological breakthroughs in hydraulic fracturing and horizontal drilling, deployed commercially from approximately 2008 onwards, transformed the United States from a major importer to the world’s largest producer. American output surged from roughly 5 mb/d in 2008 to a record 13.2 mb/d by 2024, introducing a vast volume of non-OPEC supply that the cartel could neither control nor easily counteract. The second force is broader non-OPEC production growth, particularly from Brazil, Guyana, Norway, and Canada, which has collectively added several million barrels per day of incremental supply over the past decade.
The response, in 2016, was the formation of OPEC+—an expanded alliance that brought Russia and nine other non-OPEC producers into a coordinated production management framework. This was a significant conceptual concession: the cartel’s core membership implicitly acknowledged that it could no longer set effective price floors without enlisting its erstwhile rivals. Today, OPEC’s share of global oil supply stands at approximately 30–35%, compared to over 50% in the 1970s.
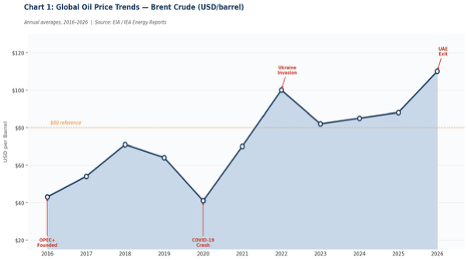
Source: U.S. Energy Information Administration (EIA), Short-Term Energy Outlook (2016–2026); International Energy Agency (IEA), Oil Market Report (various issues); World Bank Commodity Price Data (Pink Sheet). Annual averages derived from daily Brent spot price series. 2026 figure reflects year-to-date average as of April 30, 2026.
| Year | Brent Crude (USD/bbl) | Key Market Event |
| 2016 | $43 | OPEC+ formation; Saudi-Russia price cooperation begins |
| 2017 | $54 | Production cut compliance improves; demand recovery |
| 2018 | $71 | US sanctions reimposed on Iran; supply tightens |
| 2019 | $64 | Global trade war; demand slowdown fears |
| 2020 | $41 | COVID-19 demand collapse (WTI briefly turns negative) |
| 2021 | $70 | Recovery surge; vaccination rollout boosts demand |
| 2022 | $100 | Russia-Ukraine invasion; European energy crisis |
| 2023 | $82 | Demand normalisation; OPEC+ voluntary cuts |
| 2024 | $85 | Iran conflict escalation; US pressure on Gulf |
| 2025 | $88 | Sustained war risk premium; Hormuz disruption fears |
| 2026 | $88 | UAE exits OPEC; 4% intraday drop, then recovered |
II. The UAE’s Strategic Calculus: The $122 Billion Gamble
The UAE’s departure is driven by a fundamental and increasingly irreconcilable economic contradiction: the tension between its aggressive upstream investment programme and the production constraints imposed by OPEC+ membership.
Through the Abu Dhabi National Oil Company (ADNOC), the UAE has committed approximately $122 billion to expanding its production capacity to 5 mb/d by 2027—up from roughly 3.4 mb/d in 2020. This is not an incremental upgrade; it represents one of the most ambitious state-owned energy company expansion programmes in the world. Yet, under OPEC+ production discipline, the UAE was routinely restricted to output levels of 3.0–3.5 mb/d, leaving approximately 1.5 mb/d of expensive, newly installed capacity sitting idle.
The economic logic of exit is compelling when viewed through the lens of cartel theory. In any production cartel, the incentive to “cheat”—to produce above agreed quotas—is ever-present. When other members maintain discipline and drive prices higher, a defecting member can capture high prices while also selling greater volumes: a doubly profitable outcome. What the UAE has done, by formally exiting, is to transform this informal incentive into institutional reality. This phenomenon, widely described in economic literature as the “free-rider problem,” has long plagued OPEC’s internal cohesion. The UAE’s departure formalises a pattern that has, in practice, existed informally for years.
Equally important is the strategic dimension: the energy transition. The UAE’s leadership has explicitly recognised that hydrocarbon reserves are finite assets whose value is diminishing as the global economy decarbonises. Every barrel left unproduced today due to cartel discipline is a barrel that may yield lower returns a decade hence, when electric vehicles, renewable energy, and efficiency improvements have structurally suppressed demand growth. The exit is therefore also a hedge against stranded-asset risk—a calculated effort to monetise reserves while demand remains robust.
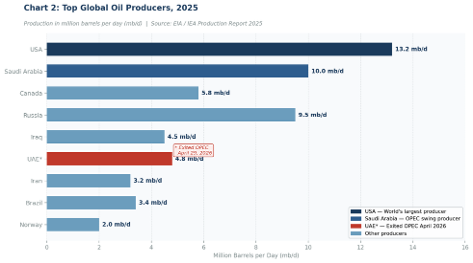
Source: U.S. Energy Information Administration (EIA), International Energy Statistics (2025); International Energy Agency (IEA), Oil Market Report — March 2026; OPEC Annual Statistical Bulletin 2025; Natural Resources Canada, Energy Facts (2025); Agência Nacional do Petróleo (ANP), Brazil. *UAE figure reflects current output post-exit from OPEC quota discipline; nameplate capacity target is 5.0 mb/d by end-2027.
| Country | Production (mb/d) | OPEC/Non-OPEC | Strategic Note |
| USA | 13.2 | Non-OPEC | World’s largest producer; swing producer role |
| Saudi Arabia | 10.0 | OPEC | Key swing producer; ~2 mb/d spare capacity |
| Russia | 9.5 | OPEC+ | Chronic quota breacher; Ukraine sanctions impact |
| Canada | 5.8 | Non-OPEC | Oil sands growth; steady non-OPEC expansion |
| UAE* | 4.8 | Ex-OPEC | Exited April 2026; capacity target 5 mb/d by 2027 |
| Iraq | 4.5 | OPEC | OPEC member; historically quota non-compliant |
| Brazil | 3.4 | Non-OPEC | Deep-water pre-salt fields; steady growth |
| Iran | 3.2 | OPEC | US blockade suppressing exports (was 1.8 mb/d+) |
| Kuwait | 2.8 | OPEC | OPEC member; relatively high compliance record |
III. The Geopolitical Shadow: War, Blockade, and the Strait of Hormuz
The UAE’s exit does not occur in a vacuum. It is simultaneously cause and consequence of a rapidly evolving geopolitical landscape in the Persian Gulf—one defined by escalating US-Iran tensions that have transformed the world’s most critical energy chokepoint into an active theatre of strategic competition.
The United States, under the current administration, has adopted a strategy of sustained maximum pressure against Iran, including the imposition of a de facto maritime blockade targeting Iranian oil exports. Before these restrictions, Iran exported approximately 1.8 mb/d; that figure has dropped dramatically, contributing to a storage crisis within Iran where the country is producing more oil than it can export or store. This supply disruption has inserted an estimated $5–15 per barrel geopolitical risk premium into Brent crude prices, maintaining elevated price levels despite structural market loosening.
At the centre of this risk architecture stands the Strait of Hormuz. This 21-mile-wide maritime passage between Iran and Oman serves as the transit route for approximately 20.5 mb/d of oil—roughly 20% of global daily consumption. For India specifically, the strategic importance of Hormuz cannot be overstated: approximately 65% of India’s crude imports transit this chokepoint. Iran has repeatedly threatened to close the Strait in response to US pressure or military action, and any such closure—even a partial or temporary one—would constitute the most severe near-term supply shock in the history of global energy markets.
The UAE’s exit, viewed through this geopolitical lens, is also a repositioning. By departing OPEC, Abu Dhabi is distancing itself from the cartel’s collective geopolitical identity—and, implicitly, from the Iran-Saudi-Russia energy governance framework—while moving closer to a bilateral security and energy architecture aligned with the United States and Asian consumer nations, including India.
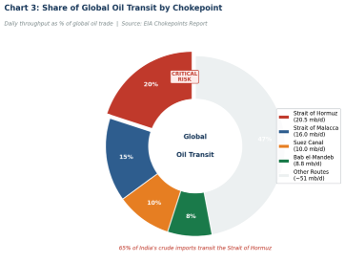
Source: U.S. Energy Information Administration (EIA), World Oil Transit Chokepoints (2024 update); International Energy Agency (IEA), Oil Security and Emergency Policy (2025); U.S. Department of Defense, Freedom of Navigation Report (2025). Volume figures represent average daily flow. India exposure data from Petroleum Planning & Analysis Cell (PPAC), Ministry of Petroleum & Natural Gas, Government of India (2025).
| Chokepoint | Daily Volume (mb/d) | Global Trade Share | Primary Risk | India Exposure |
| Strait of Hormuz | 20.5 | ~20% | US-Iran conflict / blockade | ~65% of imports — CRITICAL |
| Strait of Malacca | 16.0 | ~15% | Regional piracy; congestion | Moderate |
| Suez Canal | 10.0 | ~10% | Red Sea hostilities (Houthi) | Secondary |
| Bab el-Mandeb | 8.8 | ~8% | Yemen conflict; Houthi attacks | Secondary |
| Others | ~50 | ~47% | Distributed / lower risk | Low |
IV. The Indian Perspective: Mathematics, Macroeconomics, and Strategic Exposure
For India, the global energy drama unfolding in the Persian Gulf is not a spectator sport. As the world’s third-largest oil consumer—importing between 5.3 and 5.5 mb/d and relying on external sources for 85–87% of its crude requirements—India is structurally the most price-sensitive major economy in the global energy system. The macroeconomic linkages between crude oil prices and India’s economic performance are direct, quantifiable, and consequential.
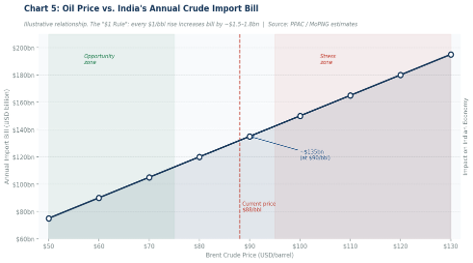
The most immediate transmission mechanism is the import bill. India’s annual crude oil import expenditure runs at approximately $150–160 billion at current price levels. The “$1 rule” has become a standard reference point in Indian economic analysis: for every $1 per barrel increase in the annual average price of crude, India’s import bill rises by approximately ₹12,000–15,000 crore (roughly $1.5–1.8 billion). A $10 per barrel sustained increase translates into an additional import burden of $15–18 billion annually.
The inflationary transmission is equally direct. Oil feeds into India’s price level through three principal channels: petroleum product prices (petrol, diesel, LPG), fertiliser costs (largely natural-gas-indexed but correlating with energy prices broadly), and logistics and transport costs embedded in the price of virtually every manufactured and agricultural good. Empirical analysis indicates that a 10% rise in crude prices typically raises India’s WPI by 0.5–0.8% and the CPI by 0.3–0.5%. The GDP impact is estimated at approximately 0.2% of annual growth for every $10/bbl sustained increase.
Perhaps the most strategically significant development of recent years is India’s supplier diversification in response to OPEC pricing dynamics. Catalysed by the Russia-Ukraine war and subsequent Western sanctions on Russian energy exports, India has dramatically restructured its import basket. Russia now accounts for over 30% of India’s crude imports—up from a negligible 2% prior to 2022—typically transacted at discounts of $10–15 per barrel. This pivot has partially insulated India from OPEC’s pricing power but has introduced a new dimension of geopolitical concentration risk.
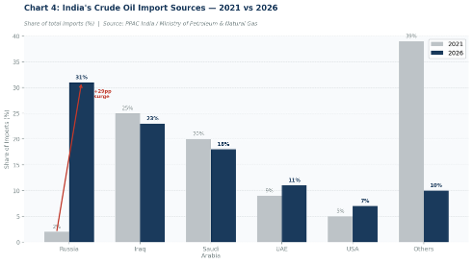
Source: Petroleum Planning & Analysis Cell (PPAC), Ministry of Petroleum & Natural Gas, Government of India — Ready Reckoner on Petroleum Statistics (2021 & 2026); Indian Oil Corporation (IOC) Annual Report 2025–26; Vortexa Analytics, India Crude Import Tracker (April 2026). 2026 figures represent January–April 2026 average based on bill-of-lading data.
| Supplier | Market Share (%) | Price vs. Benchmark | Strategic Note |
| Russia | 30%+ | −$10 to −$15/bbl | Dominant since 2023 pivot; sanctions exposure risk |
| Iraq | 23% | Approx. benchmark | Historically top supplier; OPEC quota constraints |
| Saudi Arabia | 18% | Benchmark / slight premium | Share declining; quota cuts reducing availability |
| UAE | 11% | Benchmark | Post-exit: potential for preferential bilateral deals |
| USA & Others | ~18% | Benchmark / slight premium | Diversification buffer; rising strategic importance |
Source: Petroleum Planning & Analysis Cell (PPAC), Ministry of Petroleum & Natural Gas — Indian Petroleum & Natural Gas Statistics (2024–25); Reserve Bank of India (RBI), Annual Report 2025 — Current Account Analysis; Ministry of Finance, Economic Survey 2024–25 (Vol. I, Ch. 3: Energy & Macroeconomy). The “$1 rule” (₹12,000–15,000 crore per $1/bbl) is derived from PPAC sensitivity analysis cross-validated with RBI balance-of-payments data. Import bill computed at 5.4 mb/d average consumption and 365-day basis.
| Oil Price ($/bbl) | Annual Import Bill ($bn) | vs. $80 Baseline | Approximate WPI Impact | Policy Note |
| $60 | $90 | −$30bn saving | −1.5% to −2.0% | Opportunity: aggressive SPR filling |
| $70 | $105 | −$15bn saving | −0.8% to −1.0% | Favourable: spot purchases + hedging |
| $80 | $120 | Baseline | Neutral | Baseline scenario |
| $90 | $135 | +$15bn cost | +0.5% to +0.8% | Hedge via futures; review subsidies |
| $100 | $150 | +$30bn cost | +1.0% to +1.5% | Fiscal pressure; cut non-essential imports |
| $110 | $165 | +$45bn cost | +1.5% to +2.0% | Emergency SPR draw; demand management |
V. Three Scenarios: The Shape of the Post-OPEC Order
The analytical landscape following the UAE’s exit presents three plausible trajectories for the global oil market, each with distinct implications for India.
Scenario 1: Managed Stability
OPEC continues to function, with Saudi Arabia exercising its swing-producer capacity to maintain a price band of $75–85 per barrel. The UAE’s exit proves to be an isolated case, and other members—deterred by Saudi pressure or their own fiscal breakeven requirements—maintain discipline. This is the most market-stable scenario but also the least likely given the structural incentives driving defection. For India, this implies continued moderate import costs with manageable fiscal pressure.
Scenario 2: Gradual Fragmentation
The UAE’s exit triggers a reassessment among other high-capacity producers—particularly Kuwait and Iraq—who increase output incrementally above OPEC+ quotas. Saudi Arabia loses its ability to enforce discipline, and prices drift lower toward the $65–75 range as an additional 1–2 mb/d enters the market. This is the highest-probability medium-term scenario and is broadly positive for India, offering annual import bill savings of $20–30 billion and providing space for SPR expansion and macroeconomic stabilisation.
Scenario 3: Competitive Oversupply (Price War)
Drawing parallels with the 2014–2016 and 2020 price wars, Saudi Arabia responds to UAE production expansion by opening its own taps, triggering a “race to pump” that collapses prices below $60 per barrel. This would provide dramatic near-term relief to India’s import bill—potentially saving $40–50 billion annually—but would destabilise petrostate economies, trigger political instability in Gulf nations, and potentially disrupt bilateral energy relationships India has carefully constructed.
VI. Strategic Opportunities for India: From Price-Taker to Strategic Actor
The UAE’s departure from OPEC, whatever its medium-term scenario implications, opens a clear and time-sensitive window of strategic opportunity for India. The key insight is that India, as the world’s third-largest consumer, possesses significant latent leverage that it has historically underutilised due to its reactive, import-dependent posture. The post-cartel landscape—more competitive, more bilateral, more transactional—rewards proactive strategic positioning.
Bilateral Energy Architecture with the UAE
Freed from OPEC’s collective governance constraints, the UAE can now negotiate long-term, fixed-price supply contracts directly with India—arrangements that were structurally impermissible under OPEC membership. The India-UAE Comprehensive Economic Partnership Agreement (CEPA), which entered into force in 2022, provides the institutional scaffolding for precisely such “Oil-for-Infrastructure” deals: Indian infrastructure investment in the UAE exchanged for dedicated, price-stabilised crude supply corridors.
Strategic Petroleum Reserve Expansion
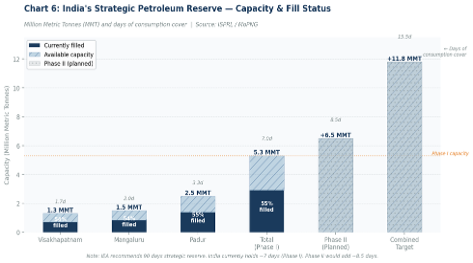
India’s current SPR capacity stands at approximately 5.33 million metric tonnes (MMT), distributed across three sites—Visakhapatnam (1.3 MMT), Mangaluru (1.5 MMT), and Padur (2.5 MMT)—providing roughly 9.5 days of consumption cover. This is critically inadequate relative to the IEA’s recommended 90-day reserve standard. Any price softening resulting from the UAE’s expanded output represents a fiscal opportunity to fill existing reserves to 100% capacity and accelerate Phase II expansion, which would add a further 6.5 MMT.
Source: Indian Strategic Petroleum Reserves Limited (ISPRL), Annual Report 2024–25; Ministry of Petroleum & Natural Gas (MoPNG), Strategic Petroleum Reserves — Status Update (March 2026); IEA, Energy Security — Strategic Reserves Policy (2024). Days-of-cover calculation based on 5.4 mb/d consumption. Phase II site data (Chandikhole, Odisha and Padur expansion) from MoPNG Cabinet Note, February 2025.
| SPR Location | Capacity (MMT) | Approx. Barrels (mn) | Days Cover | Current Fill Status |
| Visakhapatnam | 1.3 MMT | ~9.5 mn bbl | ~1.7 days | ~55% filled |
| Mangaluru | 1.5 MMT | ~11.0 mn bbl | ~2.0 days | ~55% filled |
| Padur | 2.5 MMT | ~18.3 mn bbl | ~3.3 days | ~55% filled |
| Total (Phase I) | 5.3 MMT | ~38.8 mn bbl | ~7.0 days | ~55% filled |
| Phase II (Planned) | +6.5 MMT | +47.5 mn bbl | +8.5 days | Under planning |
| Combined Target | 11.8 MMT | ~86.3 mn bbl | ~15.5 days | Post-Phase II goal |
Currency Diversification and De-Dollarisation
The India-UAE Rupee-Dirham bilateral payment mechanism, already piloted under the CEPA framework, offers a powerful instrument for reducing India’s structural vulnerability to US Dollar volatility and Federal Reserve monetary policy transmission. Expanding Rupee-Dirham oil settlements, and potentially a broader BRICS+ settlement framework for energy transactions, would partially de-link India’s import bill from the dollar cycle.
VII. Policy Recommendations for India
Short-Term Measures (0–12 months)
- Aggressive hedging: Expand India’s use of crude oil futures on the MCX and international derivatives markets to lock in favourable prices during any post-UAE-exit price softening.
- Spot market opportunism: Direct state-owned refiners (IOC, BPCL, HPCL) to increase spot market purchases from UAE and Russian producers at competitive rates.
- SPR filling: Initiate an emergency purchase programme to raise SPR fill rates from 55% to 100% during any price softening window.
- Bilateral fast-track: Convene a high-level India-UAE energy working group under CEPA to negotiate long-term supply arrangements within 90 days.
Medium-Term Measures (1–5 years)
- Supplier diversification: Reduce dependence on any single supplier below 25% of total imports; develop supply relationships with African producers, American producers, and Central Asian states.
- Rupee-Dirham oil settlement: Scale the bilateral payment mechanism to full commercial deployment, targeting 20% of UAE crude purchases in Rupee-Dirham terms by 2028.
- SPR Phase II: Fast-track Phase II capacity expansion (+6.5 MMT) to achieve a 20-day strategic reserve by 2028.
- Refinery modernisation: Upgrade refinery configurations to process a wider crude slate, reducing susceptibility to specific crude grade disruptions.
Long-Term Structural Measures (5–25 years)
- Energy transition acceleration: Reduce oil intensity of GDP by 50% by 2050 through aggressive EV adoption, public transit expansion, and renewable energy deployment.
- Net Zero 2070 anchor: Embed oil import reduction targets within India’s Energy Strategy 2050 framework, tying energy security policy to climate commitments.
- Green hydrogen investment: Position India as a green hydrogen producer and exporter, creating a long-term pathway to energy import substitution.
- Consumer-country coordination: Champion a coordination framework among India, China, Japan, and South Korea—the world’s largest crude importers—to collectively negotiate terms with producing nations.
VIII. Conclusion: The Emergence of a Fragmented Market and India’s Imperative
The UAE’s formal exit from OPEC on April 29, 2026 is not simply the departure of a single member state from an international organisation. It is a diagnostic event—a symptom of deep structural changes that have been accumulating in global energy markets for two decades and that are now producing irreversible institutional consequences.
The age of OPEC hegemony—when a cartel of producer states could effectively set global oil prices through coordinated supply management—has been in structural decline since the US shale revolution made America the world’s largest producer. The UAE’s exit accelerates and formalises that decline. OPEC will not dissolve overnight; Saudi Arabia retains its swing-producer capacity, and Russia remains within the OPEC+ framework. But the cartel’s authority to enforce discipline, set price floors, and function as the global oil market’s central bank is irrevocably diminished.
For India, this transformation is a double-edged development. On one hand, it promises a more competitive, market-driven energy landscape in which the artificial price inflation maintained by cartel discipline is progressively eroded. A world in which the UAE, Russia, the United States, and Brazil compete aggressively for market share is a world in which India’s leverage as a major buyer is structurally enhanced. The potential for bilateral energy arrangements—fixed-price contracts, currency diversification, oil-for-infrastructure deals—that were structurally impermissible under the OPEC framework has expanded materially.
On the other hand, the transition from coordinated cartel management to competitive fragmentation implies a period of heightened price volatility. Markets unmoored from institutional discipline tend toward sharper cycles. Compounding this structural risk is the acute geopolitical risk premium embedded in the current price environment by the US-Iran conflict and the ongoing threat to the Strait of Hormuz—vulnerabilities that are entirely independent of OPEC dynamics and that pose the most severe near-term supply shock risk India faces.
The path forward for India requires a dual strategy: exploiting the near-term opportunities created by a competitive post-OPEC oil landscape while simultaneously accelerating the structural energy transition that will reduce the nation’s exposure to crude price volatility over the long term. Securing discounted, bilateral crude from a newly independent UAE and maintaining the strategic Russian crude relationship—while actively diversifying the supplier base—constitutes the necessary short-to-medium-term response. Anchoring that response within a credible long-term plan to reduce oil intensity and scale renewable energy is the structural imperative.
In an era defined by geopolitical turbulence and energy market transformation, strategic adaptability will be as important as access to supply. India’s ability to navigate the emerging post-cartel energy order will be a significant determinant of its economic trajectory in the decades ahead. The “Great Decartelization,” as it may come to be known, presents the nation with both its most significant near-term energy challenge and its most consequential long-term strategic opportunity.