The Strait of Hormuz remains the world’s most consequential maritime chokepoint, yet recurrent US-led sanctions campaigns and naval deployments have conspicuously failed to halt Iranian crude exports. This paper argues that sanctions evasion in the Strait has become systemic—a structural feature of contemporary global energy trade rather than an episodic anomaly. Drawing on verified data from the International Energy Agency (IEA), the US Energy Information Administration (EIA), Kpler, Vortexa, and TankerTrackers, the study demonstrates how a shadow fleet—estimated at approximately 3,000 vessels globally as of December 2024—has institutionalised an alternative oil circuit beyond Western regulatory reach. Iranian crude exports, which collapsed to approximately 300,000–400,000 barrels per day (b/d) at the nadir of US “maximum pressure” in 2019, recovered to an average of 1.63 million b/d across January–July 2025 (Kpler; IranOilGas Network), and reached ~2.0 million b/d in September 2025 (TankerTrackers)—the highest level since mid-2018. China absorbs over 90 percent of Iranian crude exports and functions not merely as a passive consumer but as an active structural participant: as energy-security consumer, diplomatic stabiliser, and indirect systemic enabler of networked sanctions resilience. The paper conceptualises this transformation through the lenses of shadow fleet capitalism and the informalisation of global oil trade, situating Iran’s evasion architecture within a broader comparative framework that includes Russia’s parallel network, and argues that these developments signal the structural decline of US-led maritime coercion and a deeper reconfiguration of global energy governance toward multipolarity.
1. Introduction: Crisis at the Chokepoint
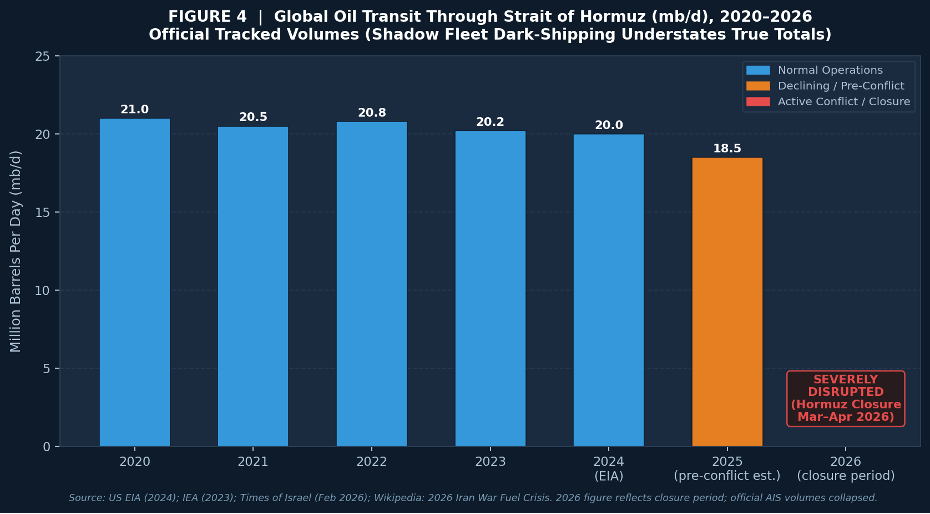
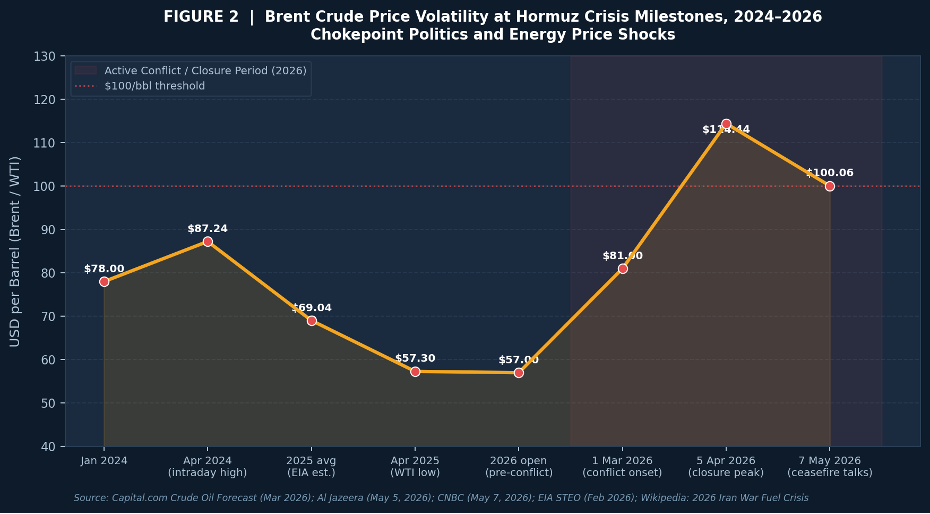
The Strait of Hormuz—at its narrowest just 41 kilometres wide between Oman and Iran—constitutes the most consequential maritime chokepoint in the global political economy of energy. Approximately 20 percent of globally traded petroleum liquids and between 20 and 25 percent of the world’s liquefied natural gas transits this corridor daily (EIA, 2024; IEA, 2023). As of May 2026, the Strait has again become the theatre of competing geopolitical forces: US-Israeli military operations, Iranian retaliation, tanker seizures, and Iran’s closure of the waterway in March 2026 drove Brent crude prices above $114 per barrel—a surge exceeding 50 percent from the pre-conflict baseline—while stranding an estimated 2,000 vessels and 20,000 seafarers (Al Jazeera, 5 May 2026; IMO, 2026).
Yet beneath this surface volatility lies a deeper structural paradox. Despite the intensification of US “maximum pressure” sanctions since May 2018—and despite significant US Fifth Fleet naval posturing—Iranian crude exports have not collapsed. They have, in fact, recovered substantially and reached a seven-year high of ~2.0 million b/d in September 2025 (TankerTrackers, November 2025). This empirical fact, corroborated by multiple independent commodity intelligence services, demands a theoretical explanation that transcends the standard narrative of coercive maritime power.
This paper argues that the answer lies in the structural informalisation of global energy trade. A shadow fleet of approximately 3,000 vessels globally (Kpler Grey Fleet Whitepaper, March 2025), operating through ship-to-ship transfers, AIS disabling, and layered ownership structures, has institutionalised a durable, adaptive trade architecture beyond Western enforcement reach. China’s role as the primary demand anchor renders it not a passive consumer but an active structural participant across three dimensions: (a) energy-security consumer; (b) diplomatic stabiliser; and (c) indirect systemic enabler. Together, these developments indicate a fundamental reconfiguration of global energy governance and the structural limits of US maritime hegemony.
Table 1: Strategic Importance of the Strait of Hormuz
| Indicator | Value / Volume | Period | Source |
| Share of global petroleum liquids in transit | ~20% of global daily consumption | 2024 | US EIA (2024) |
| Average daily throughput | ~20 million barrels per day (mb/d) | 2024 | US EIA (2024) |
| LNG trade share via Hormuz | ~20–25% of global LNG trade | 2023–24 | IEA (2023) |
| Width at narrowest navigable channel | ~3.2 km per direction (total ~41 km) | — | IMO Navigational Data |
| Supertankers transiting daily | ~17–18 per direction | 2024 | Lloyd’s List Intelligence (2024) |
| Alternative bypass pipeline capacity | ~2.6 mb/d (Saudi + UAE combined) | 2024 | Times of Israel (2026); EIA |
| Share destined for Asian markets | >80% of all Hormuz oil & gas transit | 2024 | EIA (2024) |
| Iranian proven crude oil reserves | ~208.6 billion barrels (4th globally) | 2023 | BP Statistical Review (2023) |
| Global shadow fleet vessels | ~3,000 vessels (~17–18% of tanker capacity) | Dec 2024 | S&P Global; Kpler (2025) |
2. The Strait of Hormuz in the Global Political Economy of Oil
Classical chokepoint theory, developed within the geostrategic tradition by Mahan (1890) and extended by Yergin (1991) and Klare (2008), holds that control over narrow maritime passages confers disproportionate power over global capital flows. The Strait of Hormuz is the preeminent example: it serves as the primary arterial passage for Persian Gulf producers—Saudi Arabia, Iraq, the UAE, Kuwait, and Iran—who collectively hold more than 40 percent of proven global crude oil reserves (BP Statistical Review, 2023). According to EIA data, approximately 20 million barrels per day transited the Strait in 2024, with more than 80 percent destined for Asian markets (EIA, 2024).
The strategic centrality of Hormuz generates chokepoint politics: a condition in which minor disruptions trigger outsized price and security responses, creating asymmetric leverage for weaker actors capable of threatening closure. Iran has deployed this leverage across multiple episodes—from the Tanker War of the 1980s, to drone and limpet-mine attacks in 2019–20, to the Hormuz closure of March 2026. These actions represent rational exercises in asymmetric deterrence. Bypass capacity remains severely constrained: the combined pipeline capacity of Saudi Arabia’s East-West Pipeline and the UAE’s Abu Dhabi Crude Oil Pipeline stands at approximately 2.6 million b/d—a fraction of normal Hormuz throughput (EIA; Times of Israel, 2026).
The Strait is not merely an energy artery; it is also a financial instrument. Uncertainty about Hormuz access systematically inflates oil futures, transferring wealth from consuming nations to producing states and commodity traders. A 50 percent Brent price spike during the March–April 2026 crisis—from ~$57/bbl pre-conflict to $114.44/bbl at the closure peak (Capital.com, March 2026; Al Jazeera, May 2026)—illustrates the magnitude of this chokepoint premium. This premium, paradoxically, incentivises the shadow fleet economy by widening the discount margin at which sanctioned Iranian crude trades below the spiked benchmark.
3. The Illusion of Blockade Power
The US “maximum pressure” campaign—initiated in May 2018 and extended with modifications through subsequent administrations—was predicated on the assumption that comprehensive financial and maritime sanctions, backed by naval presence, could reduce Iranian oil exports to zero. The underlying coercive bargaining logic held that revenue denial would constrain Iran’s regional power projection and compel nuclear compliance. The empirical record has confounded this assumption at every juncture.
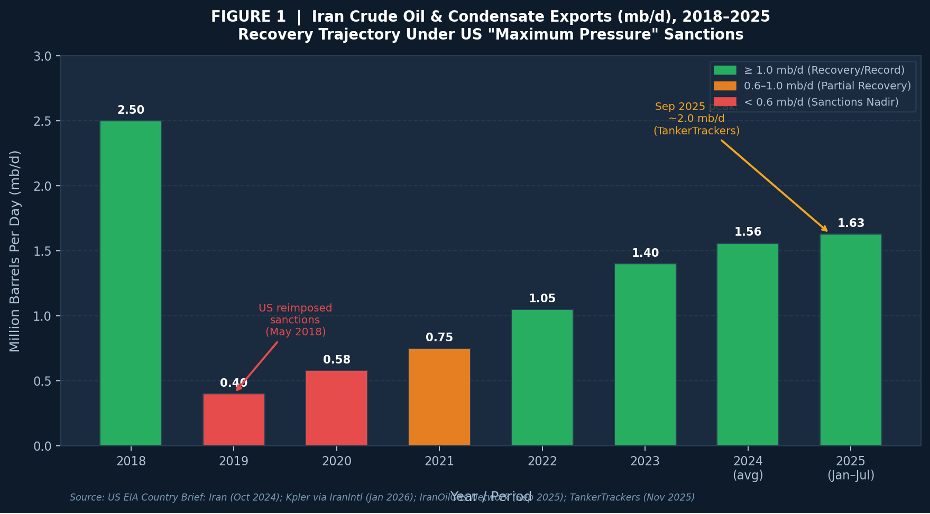
While Iranian exports declined sharply in 2018–19, reaching a nadir of approximately 300,000–400,000 b/d in mid-2019 (EIA, 2024), the subsequent trajectory demonstrates consistent recovery. By 2023, exports rebounded to approximately 1.40 million b/d; across January–July 2025, Kpler data placed the average at 1.63 million b/d—above the preceding year’s full-year average of 1.56 million b/d (IranOilGas Network, 2025). By September 2025, exports reached ~2.0 million b/d, the highest since mid-2018 (TankerTrackers, November 2025). Iran earned an estimated $53 billion in net oil export revenues in 2023, matching 2022 levels (EIA Country Brief: Iran, October 2024). Iran’s nuclear programme advanced continuously throughout the entire sanctions period (IAEA, 2024), empirically refuting the causal logic of coercive compliance theory.
Sanctioned crude now constitutes approximately 18–19 percent of global tanker capacity when Russia, Iran, and Venezuela are combined—representing roughly 6–7 percent of total crude flows (S&P Global; Middle East Institute, February 2026). This structural scale renders targeted interdiction operationally infeasible without confronting major trading partners, including China. The US government has historically and tacitly tolerated significant sanctioned flows to China precisely to avoid triggering a trade war with its principal strategic competitor (Middle East Institute, February 2026).
Table 2: US “Maximum Pressure” Claims vs. Evidential Reality (2018–2026)
| US Policy Claim / Objective | Evidence-Based Reality (2018–2026) | Verified Source |
| Iranian oil exports will be reduced to zero | Exports averaged ~1.56 mb/d (2024); ~1.63 mb/d (Jan–Jul 2025); ~2.0 mb/d (Sep 2025) | Kpler (2025); TankerTrackers (Nov 2025) |
| Financial sanctions will collapse revenues | Iran earned ~$53 bn in net oil revenues in 2023; CNY/barter settlement bypasses SWIFT | EIA Country Brief: Iran (Oct 2024); Reuters (2024) |
| Naval presence ensures compliance | Shadow fleet operates beyond enforcement reach; 23% of grey fleet manipulated AIS in 2024 | Lloyd’s List Intelligence (2024); Kpler (Mar 2025) |
| Maximum pressure will force nuclear concessions | Iran’s nuclear programme advanced continuously across full sanctions period 2018–2026 | IAEA Board of Governors Reports (2024) |
| Global isolation of Iran is achievable | China absorbs >90% of Iranian crude; China sole buyer since Dec 2024 | Kpler (2025); IranIntl (Jan 2026) |
| Sanctioned oil is a marginal phenomenon | Sanctioned crude ~18–19% of global tanker capacity (Russia + Iran + Venezuela) | S&P Global; Middle East Institute (Feb 2026) |
4. Sanctions Evasion as a System
Sanctions evasion in the Persian Gulf has undergone a qualitative transformation since 2018, evolving from ad hoc tactical manoeuvres into an institutionalised, self-reproducing system. The shadow fleet grew from an estimated 70 vessels in 2020 to approximately 550 dedicated Iranian-linked tankers by 2025 (US-China Economic and Security Review Commission, November 2025). Globally, vessels engaged in sanctioned trades for Russia, Iran, and Venezuela collectively comprise approximately 940–978 tankers—roughly 17–18 percent of the global tanker fleet—as of mid-to-late 2025 (S&P Global Market Intelligence, September 2025).
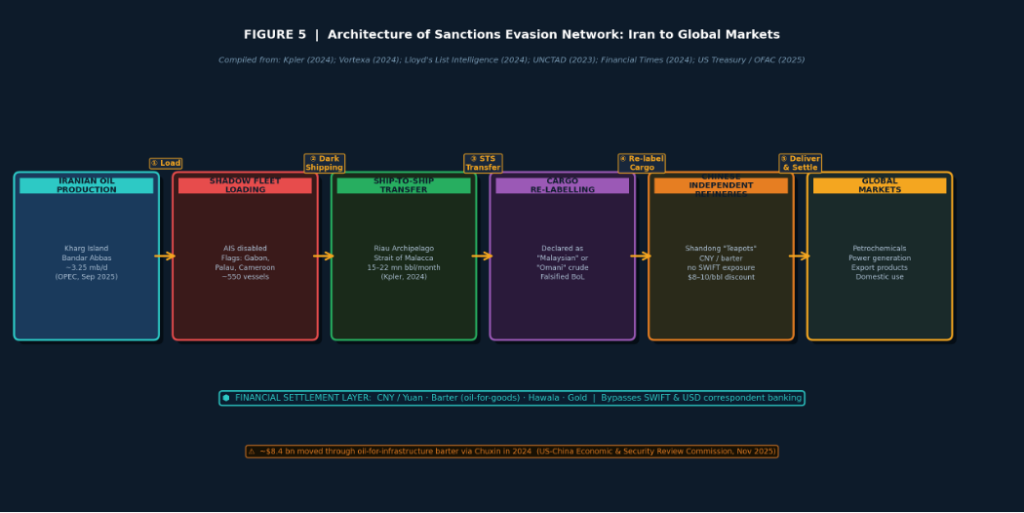
We employ the concept of shadow fleet capitalism to capture the systemic logic: the deliberate deployment of capital—in the form of ageing tankers, shell company ownership structures, and non-SWIFT financial instruments—in the service of extraterritorial commodity circulation that evades juridical oversight. Ship-to-ship (STS) transfers constitute the operationally critical node: Iranian crude is loaded at Kharg Island or Bandar Abbas; shadow-fleet vessels disable AIS transponders; at-sea transfers occur in the Riau Archipelago or the Strait of Malacca, involving volumes estimated at 15–22 million barrels per month (Kpler, 2024; Vortexa, 2024). Cargo is then declared as “Malaysian” or “Omani” in falsified bills of lading before Chinese port entry. In 2024, 23 percent of the global grey fleet manipulated AIS signals (Kpler, March 2025).
Financial settlement mechanisms parallel the shipping architecture. Yuan-denominated payment, barter arrangements—including an estimated $8.4 billion channelled through the Chuxin oil-for-infrastructure mechanism in 2024—hawala transfers, and gold-based settlement collectively bypass the USD-denominated correspondent banking system (US-China Economic and Security Review Commission, November 2025; Reuters, 2024). Nearly 40 percent of Iranian-linked tankers used false flags by 2025, including 33 vessels also servicing Russian oil exports—illustrating the growing convergence of evasion architectures (Windward/RUSI, 2025). Throughout 2025, over 70 percent of sanctioned vessels changed flags to obscure ownership (Kharon, March 2026).
Table 3: Architecture of Sanctions Evasion—Key Mechanisms and Operational Logic
| Evasion Mechanism | Operational Description | Source / Attribution |
| Ship-to-Ship (STS) Transfer | Crude transferred mid-ocean from Iranian vessel to shadow-fleet tanker; cargo declared as non-Iranian before Chinese port entry | UNCTAD Maritime Report (2023); IMO MSC; Kpler (2024) |
| AIS Disabling (“Dark Shipping”) | AIS transponders disabled to prevent satellite tracking; 23% of grey fleet manipulated AIS signals in 2024 | Kpler Grey Fleet Whitepaper (Mar 2025); Lloyd’s List Intelligence |
| Flag Switching / False Flags | Vessels re-registered under flags of convenience (Gabon, Palau, Cameroon); ~40% of Iranian-linked tankers used false flags in 2025 | Windward/RUSI Study (2025); IMO Registry Data |
| Beneficial Ownership Obfuscation | Layered shell company ownership across 3–5 jurisdictions (UAE, Hong Kong, Marshall Islands); defeats OFAC disclosure rules | Financial Times (2024); OFAC Enforcement Records |
| Document Falsification | Bills of lading describe cargo as “Malaysian” or “Omani” crude; independent inspectors routinely bypassed | Vortexa Analyst Reports (2024); Reuters (2023) |
| CNY / Barter Financial Settlement | Oil trades settled in Chinese Yuan or via oil-for-goods barter; ~$8.4 bn through Chuxin mechanism in 2024; bypasses SWIFT | US-China ESRC (Nov 2025); Reuters (2024) |
| Flag-Hopping | >70% of sanctioned vessels changed flags throughout 2025; adaptive response to enforcement listings | Kharon / Expert Analysis (Mar 2026) |
5. China’s Strategic Role in Sanctions Resilience
5a. Energy Security Imperatives
China’s engagement with Iranian crude is embedded in the structural logic of its energy security strategy. As the world’s largest crude oil importer—absorbing approximately 10–11 million b/d in 2024 (IEA, 2024)—China faces acute import dependence. Iran, with proven reserves of approximately 208.6 billion barrels (the fourth-largest globally), willingness to sell at persistent discounts of $8–10 per barrel below Brent benchmark, and political alignment against US hegemony, satisfies multiple dimensions of China’s energy calculus (BP, 2023; OilPrice.com, January 2026). Beijing’s energy security framework, embedded in successive Five-Year Plans and the Belt and Road Initiative (BRI) energy pillar, explicitly prioritises supply diversification, price hedging, and reduced reliance on politically exposed trade routes.
Iranian crude constituted approximately 13–14 percent of China’s total seaborne crude imports in 2025 (TradeInt, March 2026)—a structurally embedded supply relationship, not merely opportunistic procurement. China’s independent (“teapot”) refineries in Shandong Province, operating on margins of $2–4 per barrel, disproportionately drive demand for non-mainstream crudes. Petrochemical feedstocks accounted for 90 percent of China’s oil demand growth from 2021 to 2024 (Atlantic Council, October 2025). Discounted Iranian crude feedstock directly underwrites this sectoral expansion. China was expected to accelerate strategic crude oil stockpiling—potentially adding as much as 500,000 b/d through 2025 and into 2026—further cementing demand for discounted supplies (Atlantic Council, 2025).
5b. China’s Dominant Share in Iranian Oil Imports
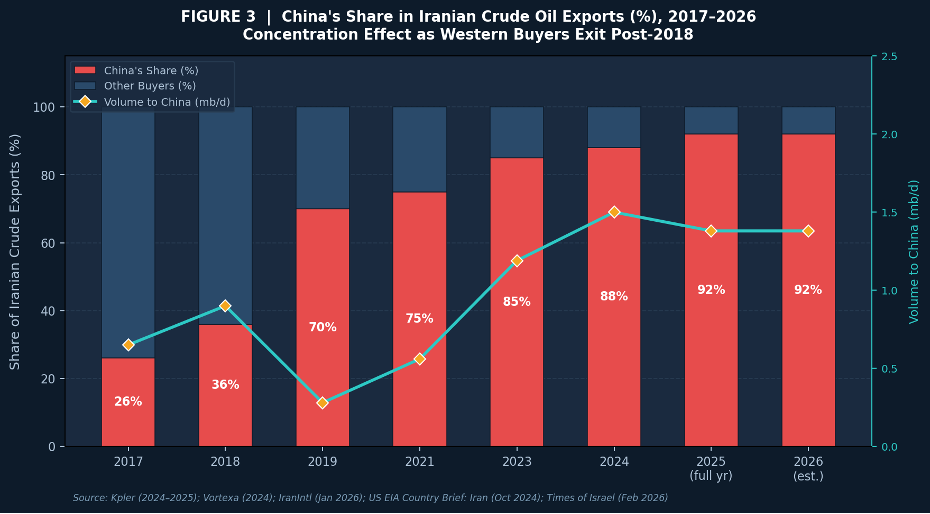
China’s dominance as the destination for Iranian crude has intensified dramatically since 2018. Prior to maximum pressure, China absorbed approximately 26 percent of Iranian exports alongside a diversified buyer base including the EU, South Korea, India, and Japan. Post-2018 enforcement effectively eliminated Western buyers and US-allied Asian partners, concentrating the residual market in China. By January 2026, after Syria halted imports in December 2024, China had become Iran’s sole crude oil buyer. Kpler data for full-year 2025 showed Iran delivering an average of 1.38 million b/d of crude oil and gas condensate to China—a decline of just 7 percent year-on-year despite the sharpest escalation of “maximum pressure 2.0” sanctions in decades (IranIntl, January 2026).
Table 4: China’s Share in Iranian Crude Oil Exports—2017 to 2026
| Year | China Share (%) | Volume to China (mb/d) | Iran Net Export Revenue | Key Development |
| 2017 | ~26% | 0.65 mb/d | N/A | Diversified buyer base: EU, South Korea, India, Japan |
| 2018 | ~36% | 0.90 mb/d | ~$53 bn (est.) | US reimposed sanctions (May 2018); non-US-allied buyers begin exit |
| 2019 | ~70% | ~0.28 mb/d | Severely constrained | Maximum pressure peak; China becomes near-sole buyer |
| 2021 | ~75% | ~0.56 mb/d | ~$37 bn (est.) | Shadow fleet capacity expanding; Chinese teapot refiners scaling up |
| 2023 | ~85% | ~1.19 mb/d | ~$53 bn (est.) | Shadow fleet fully operational; Kpler data confirms dominant share |
| 2024 | ~87–90% | ~1.50–1.65 mb/d | Elevated | Iran exports hit 5-yr high in May 2024 (Vortexa: 1.7 mb/d) |
| 2025 (full yr) | ~90%+ | ~1.38 mb/d | Under pressure (MP 2.0) | China sole buyer after Syria halted imports (Dec 2024); Kpler data |
| 2026 (est.) | ~90%+ | ~1.38 mb/d (crude + condensate) | Under pressure | Trump “MP 2.0”; Hormuz closure crisis (Mar–Apr 2026) |
5c. Diplomatic Balancing and Stabilisation
China’s diplomatic posture in the Persian Gulf demonstrates sophisticated two-level game strategy. Beijing simultaneously maintains deep economic engagement with Iran—including the landmark 25-year Comprehensive Cooperation Agreement (March 2021), which envisages up to $400 billion in Chinese investment over 25 years in exchange for discounted oil access—while publicly advocating for de-escalation, multilateral dialogue, and restraint from all parties. This is not neutral bystander behaviour. By maintaining diplomatic channels with Tehran, promoting ceasefire frameworks, and blocking or diluting punitive UN Security Council resolutions, China functions as a diplomatic shield that reduces the coercive pressure Iran faces.
5d. China as Tacit Systemic Enabler
While China does not formally direct shadow fleet operations, does not provide Iranian officials with evasion techniques, and does not openly violate UN Security Council resolutions, its structural behaviour constitutes what this paper terms structural complicity. Without Chinese demand at scale—over 90 percent of Iranian crude exports—the shadow fleet has no viable market destination. Without Yuan-denominated and barter payment mechanisms facilitated by Chinese state and private entities, Iran cannot monetise exports. Without Chinese diplomatic protection, Iran faces greater multilateral pressure. This arms-length relationship grants China plausible deniability while maximising strategic and economic benefit—the definitive characteristic of shadow fleet capitalism as a mode of systemic participation in informalised energy trade.
Major Chinese state-owned oil companies—Sinopec, Zhenhua Oil, PetroChina—have accounted for approximately half of China’s purchases of oil from Russia, and independent teapot refineries process the remainder, with analogous patterns applying to Iranian supply (US-China Economic and Security Review Commission, November 2025). The China Export and Credit Insurance Corporation (Sinosure)—China’s largest state-backed insurer—underwrites many of the infrastructure contracts funded through oil-for-goods barter arrangements with Iran, adding a dimension of quasi-state facilitation to the informal trade architecture.
5e. From Sanctions to Systems: Informalisation of Global Oil Trade
The informalisation of global energy trade represents a structural shift of first-order significance for international political economy. Classical sanctions theory—drawing on liberal institutionalism (Keohane & Nye, 1977) and coercive bargaining theory (Schelling, 1960)—assumes that the target state faces a unified, enforceable denial of market access. The Hormuz case invalidates this assumption. Iran’s experience demonstrates that when a state controls a critical export commodity (crude oil), possesses a willing large-scale buyer (China), and can access adaptive logistics infrastructure (the shadow fleet), the coercive leverage of unilateral or coalition sanctions erodes systematically over time—not episodically.
The informalisation process operates through three mutually reinforcing mechanisms: logistical informalisation (shadow fleet, STS transfers, flag switching); financial informalisation (Yuan settlement, barter, hawala); and regulatory informalisation (flags of convenience, beneficial ownership obfuscation, AIS manipulation). Each mechanism individually is addressable; their systemic interdependence renders enforcement operationally intractable without escalating to measures—secondary sanctions on Chinese banks and ports—that carry unacceptable strategic costs for the sanctioning coalition.
6. Rewiring Global Oil Flows
The Hormuz crisis has catalysed a structural bifurcation in global oil trade architecture: a formal market governed by Western-aligned regulatory norms, SWIFT-based financial settlement, and P&I club insurance; and an informal market characterised by opacity, discount pricing, and network-based trust mechanisms. This bifurcation is not a temporary disruption but a durable structural feature reshaping comparative advantage, trade routes, and the political economy of oil globally.
Southeast Asian maritime hubs—particularly the Riau Archipelago off Indonesia’s coast, the Strait of Malacca, and anchorages near Malaysia’s Johor Strait—have become critical nodes in this informal architecture. STS transfers in these locations, beyond operational Western naval enforcement reach, effectively rebrand Iranian crude as “regional origin” oil. According to Vortexa and Kpler analysis, transfers in the Riau Archipelago have at times involved 15–22 million barrels in a single month (Kpler, 2024; Vortexa, 2024). By late 2024, Iranian exports accounted for 7 percent of dirty tanker demand globally—the highest share since before the 2018 sanctions reimposition (Kpler Grey Fleet Whitepaper, March 2025).
The pricing implications are structurally significant. Iranian crude transacts at persistent discounts of $8–10 per barrel below Brent benchmark (OilPrice.com, January 2026; TradeInt, March 2026)—wider than the $7–8 discount range prevailing in early 2025. For Chinese teapot refineries operating on margins of $2–4 per barrel, this discount is commercially decisive. The existence of this discount market creates structural incentives that are difficult to overcome through incremental sanctions tightening. The formal and informal markets are increasingly interdependent: disruptions in the formal market (Hormuz closure, insurance withdrawal) drive volume into the informal circuit, strengthening the shadow architecture.
Table 5: Formal vs. Informal Oil Trade Systems—Structural Comparison
| Structural Feature | Formal / Western-Regulated Market | Informal / Shadow Market |
| Regulatory oversight | Comprehensive: OFAC, EU sanctions, IMO conventions | Minimal; regulatory arbitrage via flags of convenience and shell companies |
| Trade transparency | Full AIS visibility; audited bill of lading trail; P&I insurance documentation | Opaque; AIS dark-shipping; falsified cargo documentation; 23% AIS manipulation (2024) |
| Financial settlement | SWIFT / USD-denominated correspondent banking; standard letters of credit | CNY, barter, gold, hawala; ~$8.4 bn through Chuxin barter mechanism in 2024 |
| Insurance coverage | Western P&I clubs (Lloyd’s of London); standard P&I and H&M coverage | Non-Western clubs or self-insured; two-thirds “unknown” insurer by late 2024 |
| Price level | Brent benchmark; market-competitive pricing | Persistent discount of $8–10/bbl below Brent for Iranian crude; $10–30/bbl for Russian |
| Fleet profile | Certified, modern, compliant tankers; standard classification | Ageing vessels (15+ yrs); shadow fleet grew from ~70 vessels (2020) to ~550 Iran-linked (2025) |
| Beneficial ownership | Disclosure required (FATF standards) | Multi-layer shell structures across 3–5 jurisdictions; 40% Iranian-linked using false flags |
| Enforcement exposure | Vulnerable to OFAC/EU sanctions; port state control inspections | Adaptive: flag-hopping, name changes; >70% changed flags in 2025 |
7. Comparative Insight: Iran and Russia Sanctions Evasion
The Iran case does not stand alone. Russia’s deployment of shadow fleet architecture following the February 2022 invasion of Ukraine and the December 2022 G7 price cap on Russian crude provides a critical comparative case that deepens understanding of the systemic informalisation of energy trade. Russia, aware that sanctions would require control over oil tankers to sustain exports, replicated and scaled the evasion infrastructure that Iran had pioneered over the preceding decade—adopting the same AIS-disabling, flag-switching, and STS-transfer modalities that the Iranian shadow fleet had institutionalised (Wikipedia: Russian Shadow Fleet, 2025).
Key comparative points illuminate structural commonalities and differences. First, both Iran and Russia sell to China at significant discounts: Iranian crude at $8–10 per barrel below Brent, Russian Urals at $10–30 per barrel below the G7 price cap benchmark (Atlantic Council, 2025). Second, both rely on the same logistics ecosystem of flags-of-convenience registries, shell company ownership, and the Riau Archipelago STS hub. Third, there is documented vessel overlap: 33 tankers sanctioned for servicing Russian oil exports also service Iranian exports (Windward/RUSI, 2025). This convergence demonstrates that shadow fleet capitalism has evolved into a shared sanctions-evasion services ecosystem serving the converging interests of multiple sanctioned states (Kharon, March 2026).
Critically, however, the Russia case has elicited a substantially more energetic enforcement response than Iran, including more than 900 EU sanctions against Russian shadow fleet entities in 2025, EU tanker seizures, and the landmark German confiscation of Russian crude cargo aboard the Eventin (subsequently contested in court). This enforcement asymmetry reflects the larger scale of Russia’s oil exports, the Ukraine war context, and European energy-security motivations that are structurally absent in the Iran case. Despite this intensified enforcement, Russia’s shadow fleet maintained approximately one-sixth of global tanker capacity in mid-2025 (S&P Global, September 2025)—demonstrating the structural resilience of the informalisation architecture even under significantly higher enforcement pressure.
8. Limits of Coercive Maritime Power
The structural limits of US-led maritime coercion are not primarily military. The US Fifth Fleet retains overwhelming conventional naval superiority in the Persian Gulf region. The limits are economic, legal, and political. Economically, comprehensive interdiction of the shadow fleet would require naval enforcement action against Chinese-port-bound tankers, risking a trade war with China. Legally, sanctioned vessels operating in international waters are not committing violations under the laws of maritime nations other than the sanctioning state—a jurisdictional gap that makes seizure legally contestable, as demonstrated by the German Eventin case (Kharon, March 2026). Politically, the costs of confronting a $300 billion oil-on-water backlog (Middle East Institute, February 2026) would generate global energy price shocks incompatible with domestic political sustainability in sanctioning states.
The Middle East Institute (February 2026) notes that approximately 300 million barrels remain unsold on shadow tankers at sea, and that “past administrations have implicitly tolerated significant sanctioned flows, especially to China, to avoid sparking a trade war.” This institutional tolerance constitutes the structural precondition for the informalisation of energy trade. Operation Southern Spear—which seized at least ten tankers since December 2025—has sent a deterrent signal but achieved limited systematic impact on flows, given the adaptive capacity of the shadow fleet ecosystem (Middle East Institute, February 2026; Kharon, March 2026).
The fundamental constraint is structural: the architecture of shadow fleet capitalism is optimised for an environment of diffuse, decentralised, multi-jurisdictional enforcement. Naval blockades are optimised for the interdiction of large, identifiable, state-owned vessels—not fleets of anonymised tankers registered across multiple jurisdictions. Chokepoint politics in the contemporary era of informalised trade operates at multiple levels simultaneously: naval, financial, diplomatic, and logistical. Coercive strategies targeting only the naval dimension are structurally insufficient.
9. Implications for Global Order
The structural informalisation of global oil trade carries implications that extend far beyond the Persian Gulf. Three implications deserve sustained analytical attention. First, the erosion of the US dollar as the exclusive medium of international oil settlement—already visible in the Yuan-denominated contracts facilitating Iranian and Russian crude sales—represents a long-run structural challenge to dollar hegemony and the correspondent banking architecture that underpins Western sanctions power. While de-dollarisation remains incomplete and contested, the shadow fleet economy constitutes a working proof-of-concept for significant dollar-circumvention in commodity markets.
Second, the emergence of China as both the primary demand anchor and the diplomatic shield of sanctioned energy exporters represents a structural feature of the post-2018 international energy order, not a contingent or reversible policy choice. China’s 25-year Comprehensive Cooperation Agreement with Iran, its importation of discounted Russian Urals crude at scale (accounting for 21.5 percent of Chinese crude imports in 2024; US-China Economic and Security Review Commission, November 2025), and its tacit facilitation of shadow fleet infrastructure collectively constitute a strategic posture: energy mercantilism combined with geopolitical revisionism, operationalised through networked sanctions resilience.
Third, the informalisation dynamic creates path dependency: the institutional infrastructure of shadow fleet capitalism—tanker ownership networks, flag registry relationships, STS transfer hubs, Yuan settlement channels—represents sunk costs that create durable incentives for continued operation independent of the specific political circumstances that initially drove their creation. Even if US-Iran tensions were to de-escalate significantly, the shadow fleet economy would retain commercial viability as long as price differentials and demand incentives persist—creating a structural feature of the global energy landscape that transcends any single bilateral relationship.
10. Conclusion
This paper has argued that sanctions evasion in the Strait of Hormuz has become systemic—an institutionalised feature of contemporary global energy governance rather than an episodic or remediable anomaly. The empirical evidence is unambiguous: Iranian crude exports have recovered from the maximum-pressure nadir of ~0.40 million b/d in 2019 to ~2.0 million b/d by September 2025, generating an estimated $53 billion in net oil revenues in 2023 alone, while Iran’s nuclear programme advanced continuously throughout the sanctioned period. The shadow fleet—now comprising approximately 3,000 globally tracked vessels and 17–18 percent of global tanker capacity—has created a durable, adaptive trade architecture that operationalises the informalisation of global oil trade at commercial scale.
China’s structural role is irreducible. As energy-security consumer absorbing over 90 percent of Iranian crude, as diplomatic stabiliser providing political protection against multilateral coercive pressure, and as indirect systemic enabler providing the demand, financial infrastructure, and institutional tolerance without which the shadow fleet economy cannot function, China has transformed from a passive beneficiary of sanctions evasion into an active structural participant. The concept of structural complicity captures this relationship more precisely than either intentional co-conspiracy or passive observation.
The comparative analysis with Russia’s parallel shadow fleet architecture demonstrates that the informalisation of energy trade is not an Iran-specific phenomenon but a systemic response by multiple sanctioned large-scale oil exporters to the structural architecture of US-led maritime coercion. The shared logistics ecosystem, documented vessel overlap, and common financial settlement mechanisms constitute what Kharon (March 2026) accurately terms “a shared sanctions-evasion services ecosystem.” The structural limits of coercive maritime power in this environment are not primarily military but political, legal, and economic: the costs of comprehensive enforcement exceed the political tolerance of the sanctioning coalition, and the adaptive resilience of the informalised network systematically outpaces incremental enforcement escalation.
The deepest implication is theoretical and policy-analytical. Classical coercive bargaining theory—predicated on the assumption of enforceable denial—requires fundamental revision to incorporate the structural informalisation dynamic. In a world where a determined state possesses a critical export commodity, commands a willing large-scale buyer, and can access a shadow logistics and financial infrastructure, the coercive leverage of unilateral sanctions erodes systematically as a function of time and institutional path dependence. The Strait of Hormuz case demonstrates that beyond blockades lies a new architecture of global energy governance—one that is reshaping trade flows, currency hierarchies, and the distribution of power in the international system.