1. A Hypothesis, Tested in Real Time
Saudi Arabia’s political economy has rested on a single mechanism since the 1970s oil shocks: hydrocarbon rents converted into fiscal revenue, welfare spending and, after the 2014–16 collapse, an ambitious diversification programme. The mechanism assumes one thing, always — that oil reaches a paying buyer at a price that funds the budget. Since February that assumption has been tested more directly than at any point since 1990–91.
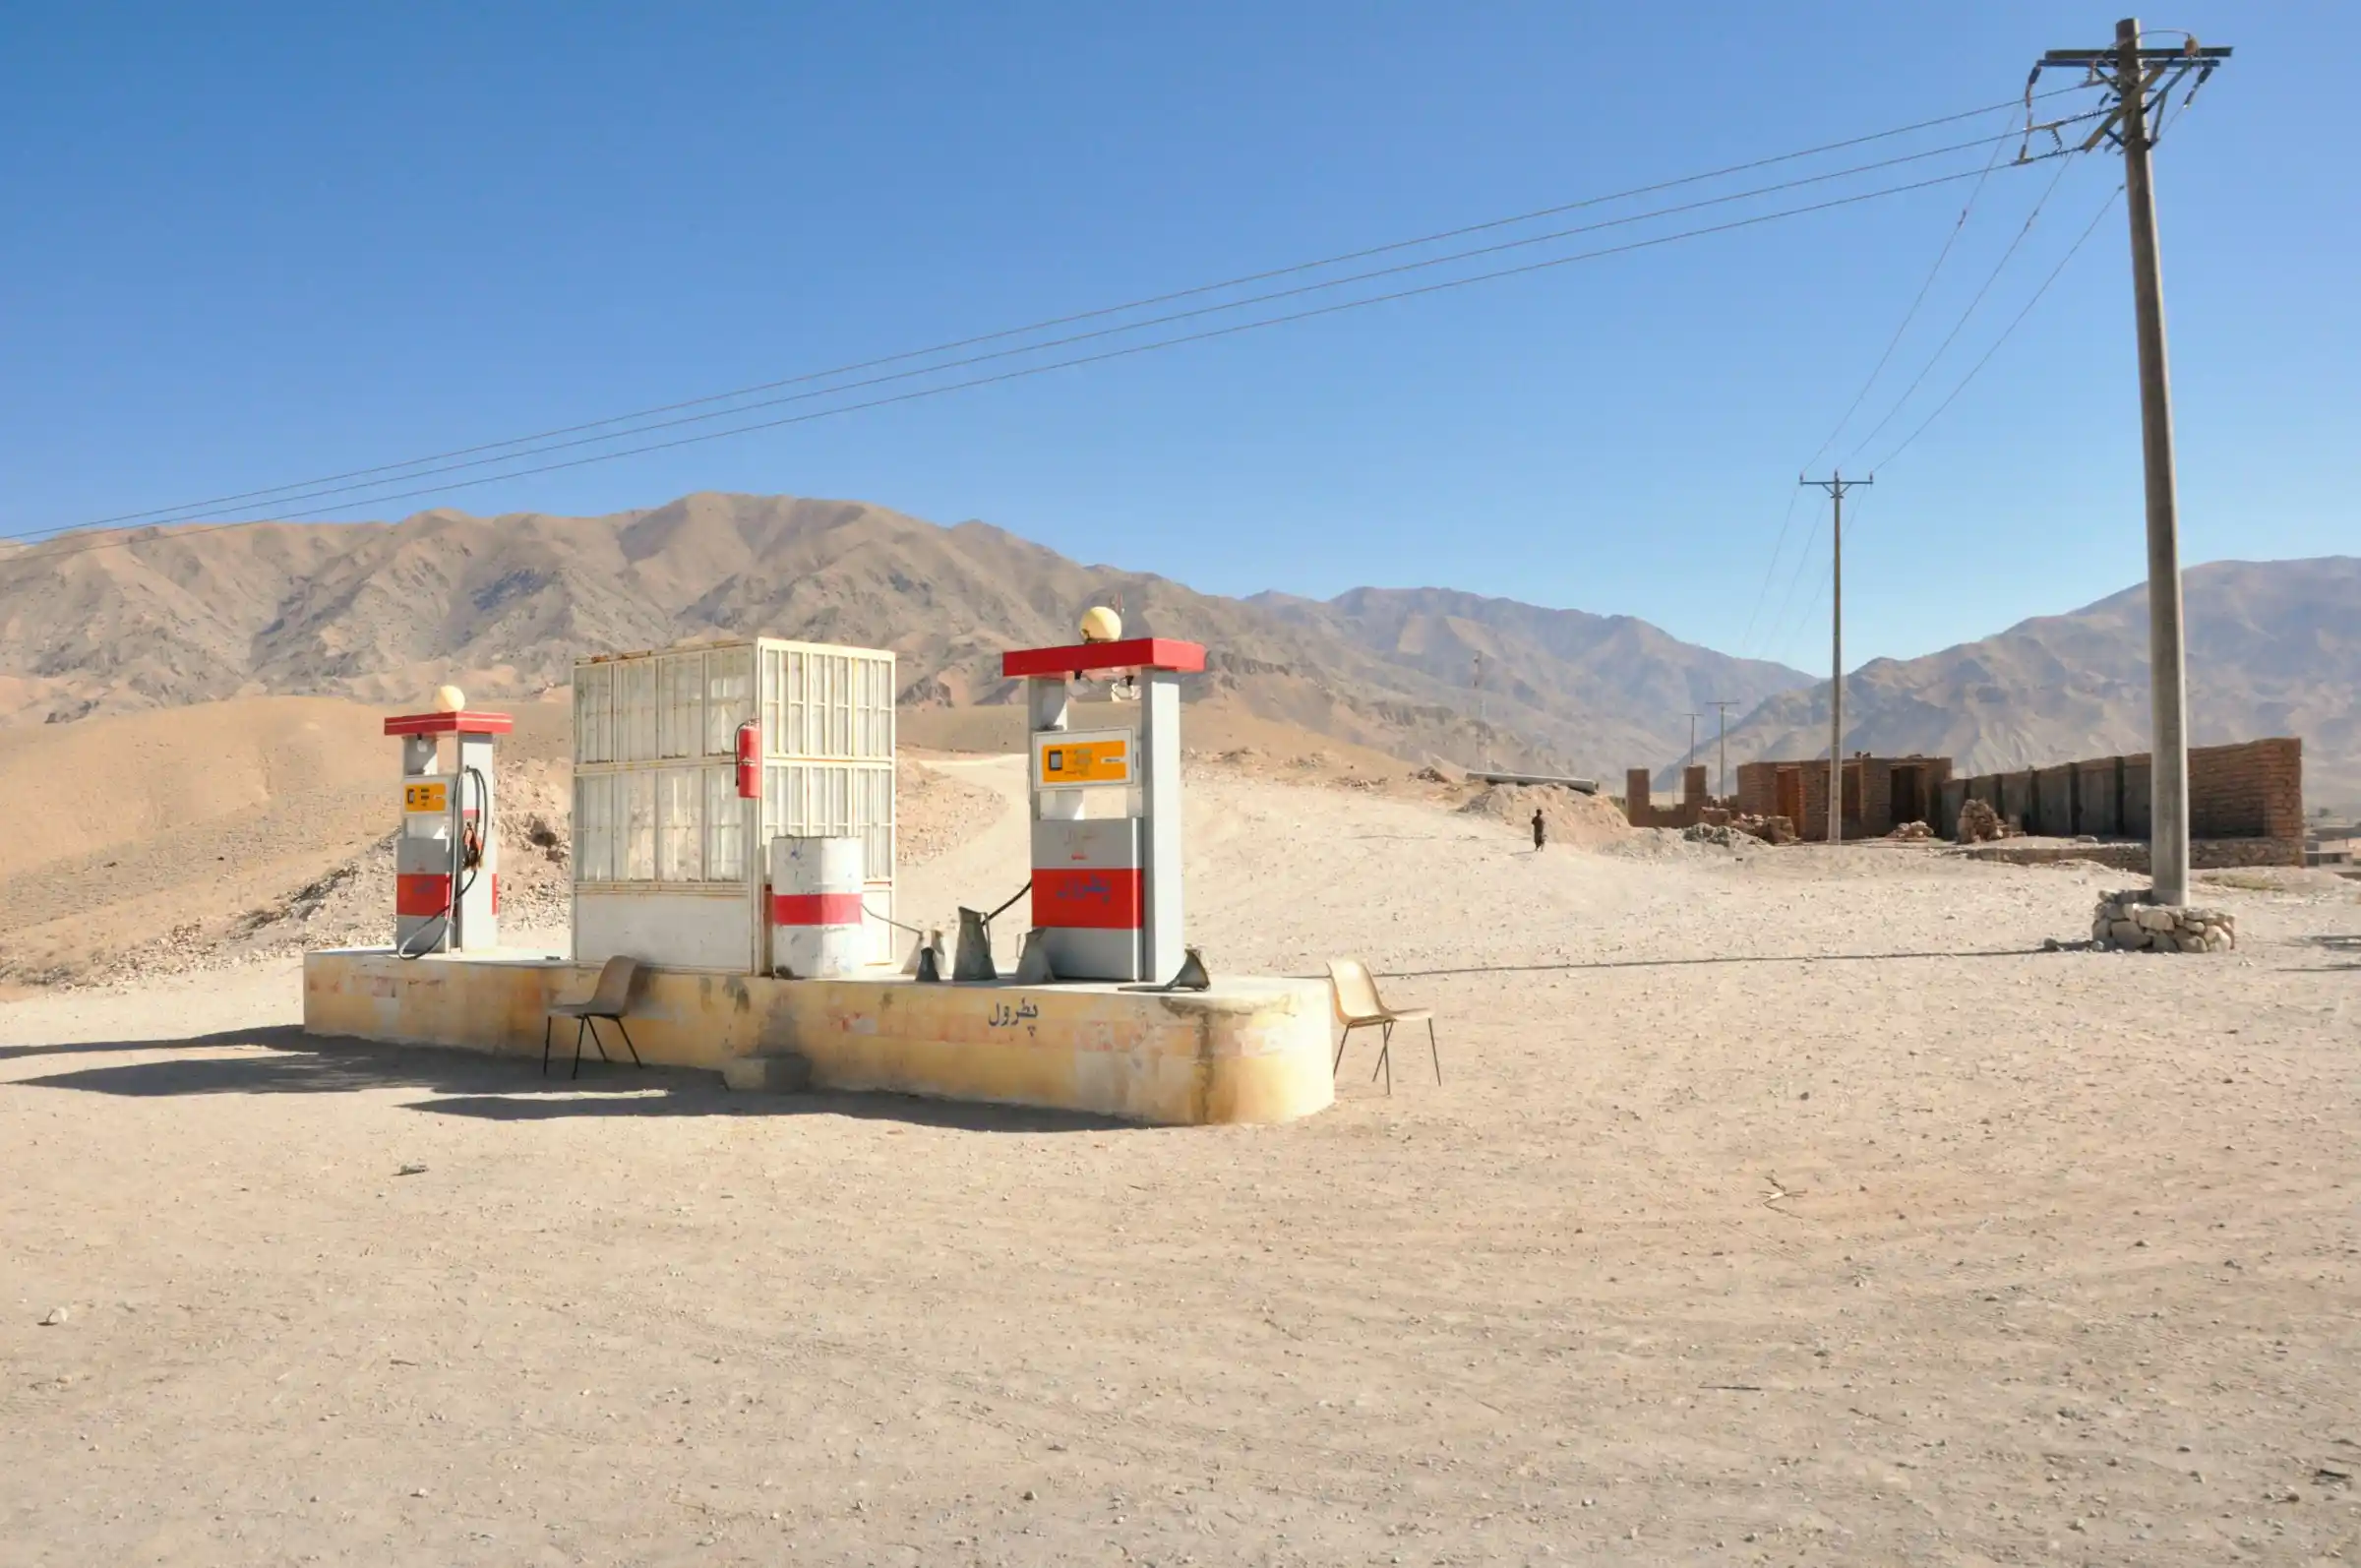
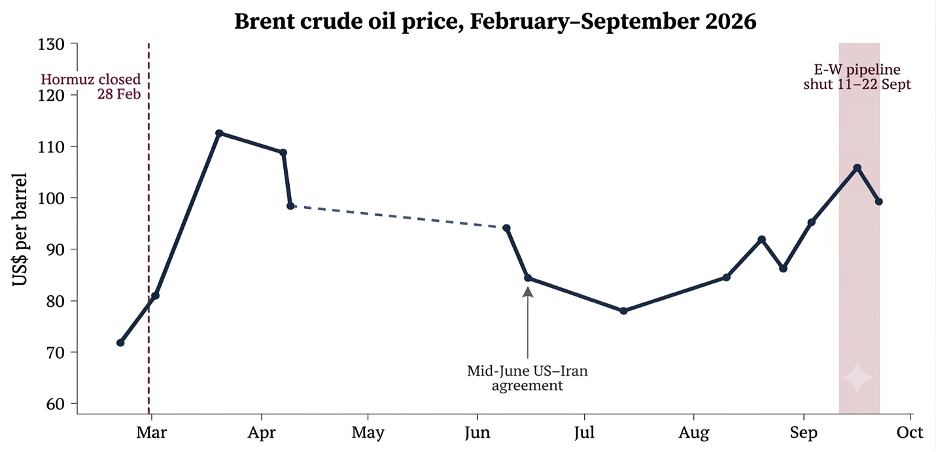
On 28 February 2026, US and Israeli strikes on Iran were followed by the near-closure of the Strait of Hormuz, the passage for roughly a fifth of the world’s oil traffic. Brent crude, in the low $70s before the war, rose past $110 in March, fell to $80 after a mid-June US–Iran memorandum, and climbed back above $100 in September (Figure 1). On 10 September, drones — launched, Riyadh said, from Iraq — struck pumping stations on the East–West pipeline, the kingdom’s principal bypass to the Red Sea. The ministry shut the line the next day: the bypass, too, was now a casualty. It restarted on 22 September at a reduced rate; Iran has since offered a seven-day reopening in exchange for eased sanctions.
This is no longer a textbook “two-door problem”; it is this paper’s question, live: has Saudi Arabia’s accumulated oil wealth and diversification effort reduced its vulnerability to oil shocks, or merely relocated that vulnerability — from the volume of oil in the ground to the reliability of getting it to a buyer?
2. Two Doors, Managed as a Portfolio
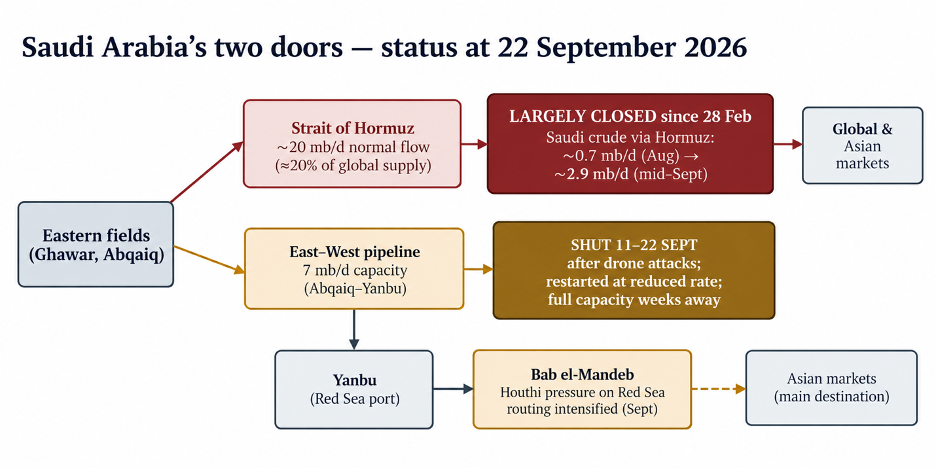
Redundancy, of a sort, was already there (Figure 2): the East–West pipeline, Abqaiq to Yanbu on the Red Sea, has a capacity of about 7 mb/d — close to the IMF’s 6.6 mb/d export projection for 2026. Riyadh used most of it, 4–5 mb/d, enough through the spring to hold exports at 60–70% of pre-war levels. Call it a portfolio, loosely; the two routes are not equivalent assets — one needs no repair, the other, once struck, needs weeks. By the revenue-neutral identity, a volume loss v needs a price rise of v/(1−v) to hold revenue constant: 43–67% for a 30–40% loss, real money but far short of the triple-digit rise a bypass-free closure implies.
September tested that portfolio. With the western door shut from 11 to 22 September, Riyadh pushed crude back east along a corridor the US military helps secure off Oman: Kpler puts Saudi exports at roughly 6 mb/d in September, level with 2025’s average and up nearly 80% on August. Brent, having touched almost $110 right after the shutdown, was back under $100 by the 22nd. Convenient, not free: the eastern door leans on American cover Riyadh does not command, the western on repairs it cannot rush. April’s strike was fixed in three days; September’s took eleven just to reach a reduced-rate restart.
3. An Ambiguity, Priced by the Market
Markets have since priced an ambiguity this paper’s model could only gesture at — that a shock can raise revenue per barrel even as it cuts volume shipped. Goldman Sachs put Saudi Arabia’s weekly oil revenue at roughly 10% above pre-war levels in the war’s opening months — price outrunning volume — while the UAE, with a far smaller bypass, saw the reverse: revenue down around 25%, a 6%-of-GDP fiscal surplus nearly gone.
Two cases do not make a mechanism, and such estimates lean on tanker data rather than customs figures — but the contrast fits the variable this paper treats as decisive: bypass capacity, not exposure. Official accounts confirm the direction, if not the scale: oil revenue rose 22% year on year in Q2 alone, faster than the first-half average — Q1’s disruption, evidently, was the sharper drag. Even so, the windfall was fiscally thin: Goldman put Saudi Arabia’s own deficit improvement at only about one point of GDP, a reminder that favourable prices are a shallow cushion against a structural problem.
4. Economic Diversification Is Not Fiscal Diversification
Nine percent — the rise in Saudi oil revenue, year on year, H1 2026. Relief, on the face of it, but it has not closed this paper’s real gap: growing the non-oil economy versus reducing dependence on oil revenue (Table 1). Spending, the same six months, rose 15%; non-oil revenue, 2%. Run the ratios and diversification moves the wrong way — non-oil revenue funded 36% of spending, not 40%; oil income covered 67% of the gap between spending and non-oil revenue (call it an ex post break-even) against 76% a year earlier. The fiscal position worsened, in other words, even as the price rose. The SAR 160 billion deficit, entirely debt-financed, had used 97% of the year’s budgeted shortfall by June.
Malik and Nagesh (2020) had flagged the regional pattern: fiscal sustainability across the GCC is “mostly unrelated to the degree of economic diversification.” Saudi Arabia looks, crudely, like the exception — oil’s revenue share fell from 64% in 2019 to 55% now. Look closer and it thins: part of the fall is a 2020 tax change, VAT tripled from 5% to 15%, not organic growth; the rest still tracks price more than the base broadening — procyclical dependence masquerading as reform. It still sits well above oil’s GDP share (29–43% in 2018): the fiscal-versus-economic gap this paper is about. The non-oil economy itself holds up, 2.6% projected, even as headline growth fell from 4.5% to 1.7%. Vision 2030’s giga-projects deepen this tension rather than resolve it: PIF investment is capitalised largely from oil-derived assets — a model asked to fund the end of its own dependence.
Table 1. Saudi Fiscal Performance, H1 2025 vs. H1 2026
| Indicator | H1 2025 | H1 2026 |
| Oil revenue (SAR bn) | 301.5 | 329.9 (+9% y/y) |
| Non-oil revenue (SAR bn) | 263.7 | 269.9 (+2% y/y) |
| Government spending (SAR bn) | ~660.7* | 759.8 (+15% y/y) |
| Non-oil revenue ÷ spending | 39.9% | 35.5% |
| Oil ÷ total revenue | 53.4% | 55.0% |
| Oil revenue ÷ (spending − non-oil revenue)† | 75.9% | 67.3% |
| H1 deficit (SAR bn) | ~95.5* | 160.0 (97% of full-year budget) |
5. Three Architectures, One War
The war sharpens the comparison (Table 2). Norway is not oil-light in trade terms — petroleum was 61% of exports in 2024 — but its rule routes revenue through a fund invested abroad, spending only the expected real return: neither chokepoint nor price spike reaches the budget directly. Dubai, having substituted trade and credit for rent, is exposed at one remove: oil is ~1% of its own GDP, yet its customers’ purchasing power is oil-derived. Saudi Arabia has neither Norway’s insulation nor Dubai’s indirection: rents, diversification spending and chokepoint exposure sit in the same accounts. Nor is copying Norway merely technical: it built its fund over decades of headroom; Riyadh is retrofitting discipline onto a far larger social contract, mid-transition. A war that lifts the price lifts Vision 2030’s funding too — only for as long as a barrel reaches a buyer.
Table 2. Comparative Architectures of Oil-Rent Management
| Dimension | Saudi Arabia | Norway | Dubai |
| Oil dependence | 29–43% of GDP; 53–64% of central revenue; ~78% of exports (2018) | Petroleum 61% of goods exports (2024); revenue routed to the fund | Oil ~1% of GDP (2014); trade, logistics, services |
| Fiscal rule | None binding | Spend only the fund’s expected real return (3% since 2017) | None; borrowing via government-related entities |
| 2026 war exposure | Direct: chokepoint disruption, offset in part by price | Price windfall; no Gulf chokepoint exposure | Indirect: oil-derived regional demand |
| Transmission | Oil rents → PIF → giga-projects → non-oil growth + fiscal commitments | Oil rents → sovereign fund abroad → rule-bound spending | Trade/logistics → infrastructure → global capital |
6. Conclusion
After seven months the hypothesis survives, more qualified than either side’s headlines suggest. Reserve quantity was never the binding constraint; monetisation is. The evidence cuts against helplessness: redundancy worked, more or less — the IMF credits “diversified logistical and oil infrastructure” — and Riyadh shifted volumes between doors within days. It did not touch the dependence underneath: oil revenue rose 9% in H1, yet the deficit had used 97% of its annual budget by June, and most of that revenue-share narrowing since 2019 is a tax change and a price cycle, not a broader base. Vision 2030’s fiscal foundation remains the price of oil, not the size of the non-oil economy. The sharpest lesson is definitional: oil abundance is not oil security, infrastructure is not autonomy — the western door depends on repairs and a contested Red Sea, the eastern on American cover Riyadh does not command.
The era of easy oil is not ending because Saudi Arabia’s fields are emptying. It is ending because the barrel can no longer be assumed to reach the buyer — and because, unlike Oslo, Riyadh’s finances still require that it does.
Reference
AGBI. 2026. “War Restricts Saudi Growth but Worse Expected to Come.” April.
Al Jazeera. 2026. “Saudi Arabia Shuts Critical Oil Pipeline After Drone Attack: What It Means.” 12 September.
Arab Center Washington DC. 2026. “Vision 2030 and the Iran War: Saudi Arabia’s Resilience Under Strain.”
Arab News. 2026. “Saudi Arabia’s H1 2026 Budget Performance Report.” July.
Argaam. 2026. “Saudi Arabia’s Public Finance Report, Second Quarter 2026.” August.
Baycar, Hamdullah. 2020. “The Sudden Cost of Unexpected Threats: The Novel Coronavirus and Dubai.” Qatar University QSpace.
Bloomberg, reported in gCaptain. 2026. “Saudi Arabia Set for Oil Windfall After Hormuz Boosts Prices.” 2 May.
Business Recorder. 2026. “IMF Says Saudi Economy Holding Up During Iran War but Growth Could Slow to 2% in 2026.”
Calmfors, Lars, and Timothy Heleniak. 2020. Fiscal Frameworks and Fiscal Sustainability in the Nordics. Nordic Council of Ministers.
CNBC. 2026. “Oil Prices Fall After U.S. Says Damaged Saudi Pipeline Will Restart Operations in Days.” 16 September.
Haque, Mohammad Imdadul. 2020. “Assessing the Progress of Exports Diversification in Saudi Arabia: Growth-Share Matrix Approach.” Problems and Perspectives in Management 18 (3): 118–28.
Malik, Monica, and Thirumalai Nagesh. 2020. “Fiscal Sustainability and Hydrocarbon Endowment Per Capita in the GCC.” In The Political Economy of the Middle East. Springer Nature.
Norwegianpetroleum.no (Norwegian Ministry of Energy and Norwegian Offshore Directorate). 2025. “Exports of Oil and Gas.” Updated 26 February.
Reuters, via Yahoo Finance. 2026. “Saudi Arabia Restarts East-West Oil Pipeline, Sources Say” and “Oil Prices Settle Lower as Crude Flows from Middle East Improve.” 22 September. The National. 2026. “Saudi Arabia Closes East-West Oil Pipeline Following Attacks.” 11 September.